DocsEmissary-ingress
2.2
The metrics endpoint
The metrics endpoint
For an overview of other options for gathering statistics on Emissary-ingress, see the Statistics and Monitoring overview.
Each Emissary-ingress pod exposes statistics and metrics for that pod at
http://{POD}:8877/metrics. The response is in the text-based
Prometheus exposition format.
Understanding the statistics
The Prometheus exposition format includes special "HELP" lines that make the file self-documenting as to what specific statistics mean.
envoy_*: See the Envoy documentation.ambassador_*(new in 1.7.0):ambassador_edge_stack_*(not present in Emissary-ingress):ambassador_edge_stack_go_*: See [promethus.NewGoCollector()][].ambassador_edge_stack_promhttp_*Seepromhttp.Handler().ambassador_edge_stack_process_*: See [promethus.NewProcessCollector()][]..
ambassador_*_time_seconds(for*= one ofaconf,diagnostics,econf,fetcher,ir, orreconfiguration): Gauges of how long the various core operations take in the diagd process.ambassador_diagnostics_(errors|notices): The number of diagnostics errors and notices that would be shown in the diagnostics UI or the Edge Policy Console.ambassador_diagnostics_info: Info about the Emissary-ingress install; all information is presented in labels; the value of the Gauge is always "1".ambassador_process_*: Seeprometheus_client.ProcessCollector.
Polling the :8877/metrics endpoint with Prometheus
To scrape metrics directly, follow the instructions for Monitoring with Prometheus and Grafana.
Using Grafana to visualize statistics gathered by Prometheus
Sample dashboard
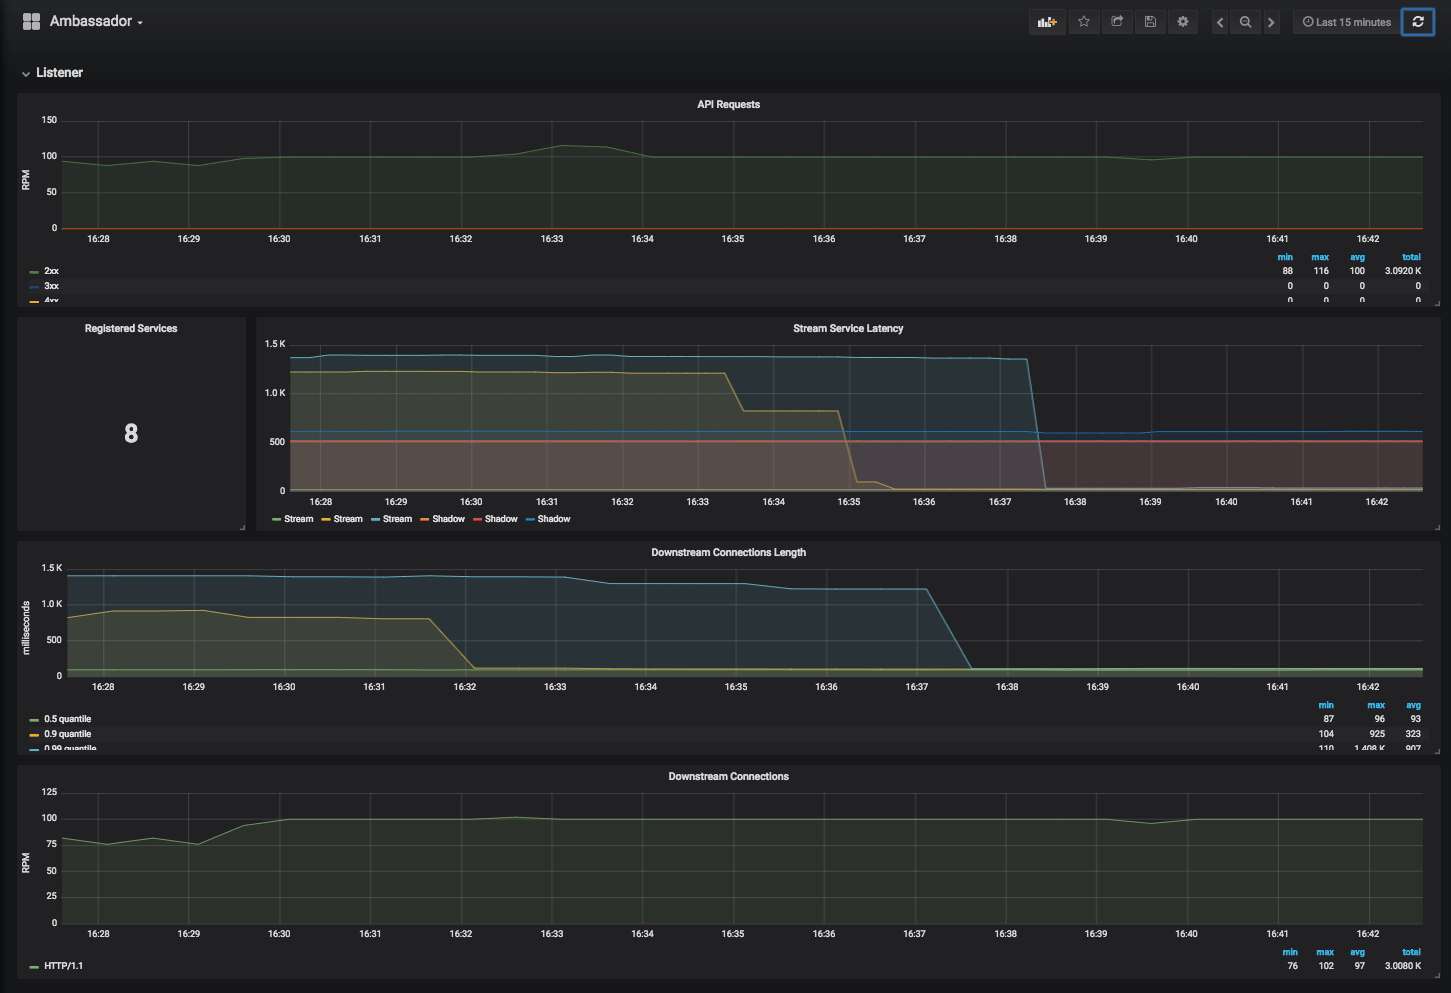
We provide a sample Grafana dashboard
that displays information collected by Prometheus from the
:8877/metrics endpoint.
Just Envoy information

Alex Gervais has written a template Emissary-ingress dashboard for
Grafana that displays information collected by Prometheus either
from the :8877/metrics endpoint, or from Envoy over
StatsD. Because it is designed to work with
the Envoy StatsD set up, it does not include any of the ambassador_*
statistics; because of this, we recommend using the other sample
dashboard above.


