DocsEdge Stack
1.14
Diagnostics
Diagnostics
If you're experiencing issues with Ambassador Edge Stack, log in to your Edge Policy Console and choose from the left menu whether you want to:
- Debug issues from the Debugging tab
- Check the health status of your services from the Mappings tab
Debugging
If Ambassador Edge Stack is not routing your services as you'd expect, your first step should be Ambassador Edge Stack Diagnostics in the Edge Policy Console. Login to your Edge Policy Console and select the "Debugging" tab from the left menu.
Some of the most important information (your Ambassador Edge Stack version, how recently Ambassador Edge Stack's configuration was updated, and how recently Envoy last reported status to Ambassador Edge Stack) is right at the top. See Debugging for more information.
Health status
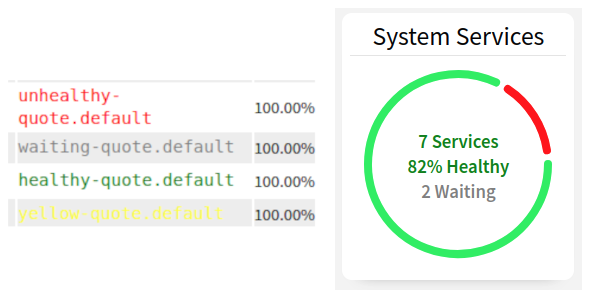
Ambassador Edge Stack displays the health of your services on the Dashboard of your Edge Policy Console. Health is computed as successful requests / total requests and expressed as a percentage. The "total requests" comes from Envoy upstream_rq_pending_total stat. "Successful requests" is calculated by substracting upstream_rq_4xx and upstream_rq_5xx from the total.
- Red is used when the success rate ranges from 0% - 70%.
- Yellow is used when the success rate ranges from 70% - 90%.
- Green is used when the success rate is > 90%.
- Grey is used when a service is "waiting". This means the success rate cannot be determined because the service has not recieved any requests yet.

The LEFT image shows what a list of services under the Debugging tab in the Edge Policy Consul will look like for each level of health.
The RIGHT image shows the dial on the hompage of the Edge Policy Console, this will display the ratio of services that are healthy according to these measurements.
Troubleshooting
If the diagnostics service does not provide sufficient information, Kubernetes and Envoy provide additional debugging information.
If Ambassador Edge Stack isn't working at all, start by looking at the data from the following:
kubectl describe pod <ambassador-pod>will give you a list of all events on the Ambassador Edge Stack podkubectl logs <ambassador-pod> ambassadorwill give you a log from Ambassador Edge Stack itself
If you need additional help, feel free to join our Slack channel with the above information (along with your Kubernetes manifest).
You can also increase the debug of Envoy through the button in the diagnostics panel. Turn on debug logging, issue a request, and capture the log output from the Ambassador Edge Stack pod using kubectl logs as described above.
ON THIS PAGE


